When adding futures market data to TWS, you can now select a "continuous" futures contract, which is a series of monthly/quarterly contracts spliced together.
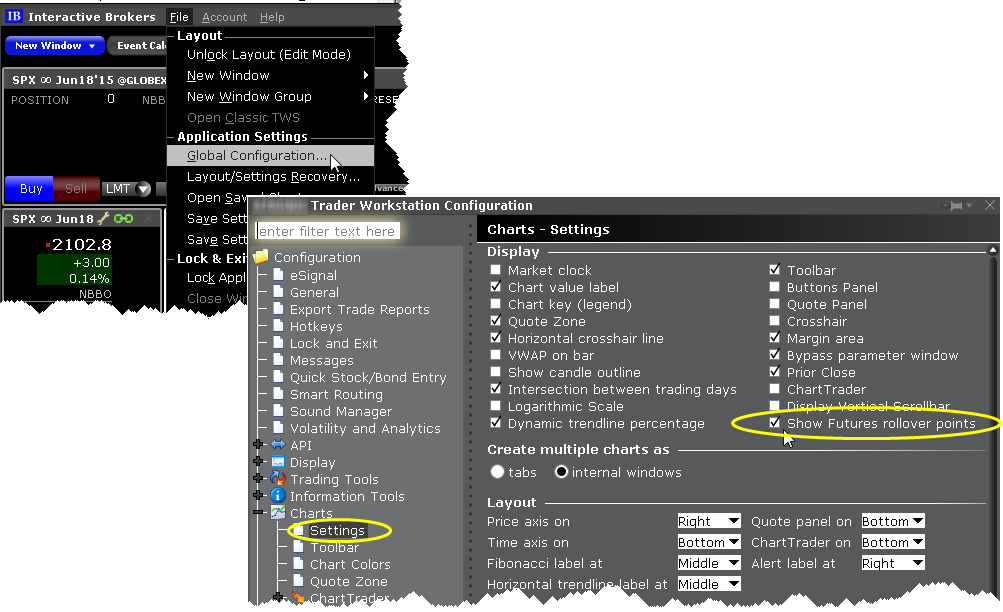
When a futures contract expires (and if you have the feature enabled in Global Configuration), the system will automatically add the new lead month futures contract and removed the expired contract. When you use a Continuous Futures contract, it is no longer necessary to roll contracts, or to manually re-enter the new lead month if Automatic Rollover is disabled.”Additionally, it allows you to chart the future across multiple expiries, and apply moving averages and other technical studies that aren't relevant with the limited life of a single monthly or quarterly contract.
Find out about...
Adding a continuous futures contract
Generating normalized historical data series for Continuous Futures
To enter a continuous futures contract using Mosaic Watchlist
1. Click in an empty row and enter the underlying symbol.
2. Hit enter, and select the futures contract from the list.
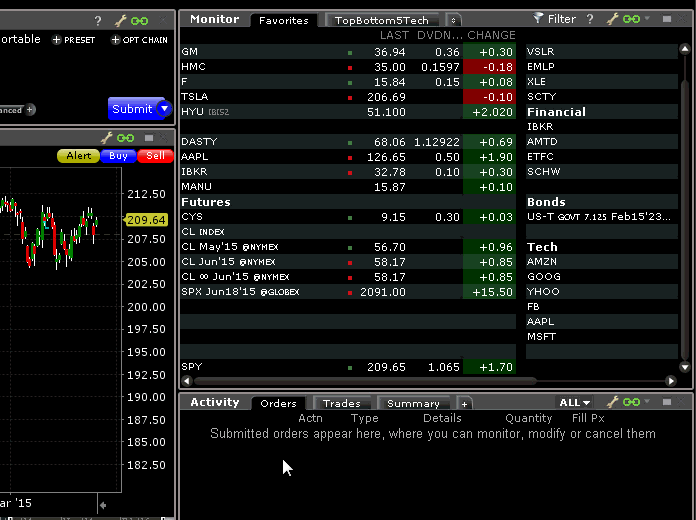
3. From the selector, choose the contract with the infinity sign (∞)which denotes a continuous futures contract.
Note: The market data line for the future will also show the infinity sign.
To see the Ratio Adjustment (RA) Points on a chart
Note: Note that these continuous contracts are for market data only; orders on futures are not updated. If you select a non-continuous contract, the Automatic Futures Rollover feature (if enabled) will notify you that the contract is expiring.
A "continuous futures" contract represents a sequence of successively expiring lead futures contracts along with an associated interval during which each future is the lead. This allows us to construct a normalized historical data series for the contract. For example, we can construct a continuous futures contract for CL@NYMEX using the following contracts:
CL MAY'15
CL APR'15 20150317
CL MAR'15 20150217
CL FEB'15 20150115
CL JAN'15 20141216
CL DEC'14 20141117
CL NOV'14 20141016
CL OCT'14 20140917
CL SEP'14 20140817
CL AUG'14 20140717
CL JUL'14 20140617
CL JUN'14 20140515
CL MAY'14 20140417
The above list of sequential contracts shows the lead end dates when the particular contract stops being the lead contract and the next one takes over.
To generate a normalized historical data series for the above sequence, call CL MAY'15 as Contract A and CL APR'15 as Contract B. Then follow the steps below:
1. Take the closing price of Contract B and Contract A on 20150317.
2. Calculate the ratio of closingPrice(Contract A)/closingPrice(Contract B).
3. Multiply all Contract B data for 20150317 and all prior dates by this ratio. This results in the adjusted time series of Contract B having the SAME closing price on 20150317 as Contract A.
4. Repeat for prior months.